Let's be honest: spreadsheets are powerful, but they're terrible for user experience. When was the last time you enjoyed scrolling through hundreds of rows in an Excel file on a website? Never, right?
That's exactly the problem our Interactive Data Table module solves. It transforms overwhelming data dumps into engaging, searchable, and sortable experiences that your users will actually appreciate.
Why Traditional Data Tables Fail Users
Picture this: You're shopping for a laptop online. The website shows you a massive table with 200 products, each with 15 specifications. No search. No filters. Just endless scrolling and squinting at tiny text on your mobile device.
Frustrating, right? That's the reality of poor data presentation. Users abandon these experiences within seconds. According to recent UX studies, 88% of users won't return to a website after a bad experience, and confusing data tables are a major culprit.
The Pain Points:
- Information Overload: Users feel overwhelmed when presented with hundreds of unsorted rows
- Mobile Nightmare: Traditional tables break on smaller screens, requiring awkward horizontal scrolling
- No Context: Without search or sorting, users can't find what they're looking for
- Poor Accessibility: Screen readers struggle with poorly structured tables
- Analysis Paralysis: Too many options without filtering tools leads to decision fatigue
How Interactive Data Tables Transform User Experience
An interactive data table isn't just a pretty face—it's a fundamental shift in how users interact with information. Here's what makes the difference:
1. Instant Search Functionality
Users can type what they're looking for and instantly filter results. Looking for "wireless headphones under $100"? Type it in, and irrelevant products disappear. This single feature can reduce task completion time by 70% according to usability studies.
Real-World Example: An online electronics retailer implemented searchable product tables and saw their bounce rate drop from 65% to 32% on product comparison pages. Users could finally find what they needed without endless scrolling.
2. Smart Column Sorting
Click a column header, and boom—data reorganizes instantly. Want to see the cheapest options first? Click "Price." Need the highest-rated products? Click "Rating." This puts users in control of how they consume information.
Sorting isn't just convenient; it's expected. Modern users have been trained by platforms like Amazon, Google, and LinkedIn to expect this functionality. When it's missing, your site feels outdated.
3. Pagination That Makes Sense
Instead of endless scrolling (which causes "infinite scroll fatigue"), smart pagination breaks data into digestible chunks. Users can process 10-25 items at a time, make decisions, and move forward without cognitive overload.
The module includes customizable entries-per-page options. Different use cases need different page sizes:
- Product catalogs: 12-24 items (visual browsing)
- Transaction histories: 50-100 items (quick scanning)
- Directory listings: 25 items (balanced approach)
4. Mobile-First Responsive Design
Here's where traditional tables completely fail. Our interactive table adapts beautifully to any screen size. On mobile devices, columns stack vertically, search stays accessible, and sorting remains functional. Over 60% of web traffic is now mobile—your data needs to work everywhere.
Real-World Applications That Drive Results
Let's talk about where interactive data tables shine in actual business scenarios:
E-Commerce Product Comparisons
Imagine you sell outdoor equipment. A customer wants to compare camping tents. With an interactive table, they can:
- Search for "4-person waterproof"
- Sort by price to fit their budget
- Click rating to see top-reviewed options
- Filter by brand or specific features
This isn't theoretical. One outdoor retailer reported a 43% increase in add-to-cart rates after implementing searchable product comparison tables. Users could actually make informed decisions instead of giving up in frustration.
Service Directories and Listings
Running a business directory? Local restaurant guide? Service marketplace? Interactive tables are perfect for helping users find exactly what they need:
Case Study: A freelance marketplace switched from static listings to interactive tables with search and sorting. User engagement increased 156%, and the average session duration jumped from 2 minutes to 7 minutes. Why? Users could finally filter by skills, rates, and ratings to find the perfect match.
Dashboard Analytics
Business dashboards generate massive amounts of data. Sales figures, user metrics, performance indicators—it all needs organization. Interactive tables let stakeholders:
- Search for specific date ranges or campaigns
- Sort by performance metrics to identify winners and losers
- Export filtered data for deeper analysis
- Share specific views with team members
Customer Account Management
Order histories, transaction logs, support tickets—customers need to find information quickly. An interactive table with search means they can type an order number or product name and instantly locate what they're looking for, instead of calling your support team.
The Psychology Behind Better Data Tables
Why do interactive tables work so well? It comes down to cognitive psychology:
Reducing Cognitive Load
Our brains can only process 5-9 items at once (Miller's Law). Pagination respects this limitation. Search and sorting reduce the mental effort required to find information. When users don't have to think hard, they stick around longer.
Providing Control
Users hate feeling powerless. When they can search, sort, and filter, they feel in control. This sense of agency improves satisfaction and trust. You're not forcing information on them—you're empowering them to find what they need.
Building Progressive Disclosure
Instead of overwhelming users with everything at once, interactive tables reveal information progressively. Start with a manageable view, then let users drill down. This approach reduces anxiety and decision paralysis.
Implementation Best Practices
Having the module is one thing; using it effectively is another. Here are proven strategies:
Choose the Right Data
Not everything belongs in a table. Perfect candidates include:
- Product catalogs with multiple comparable attributes
- Transaction or order histories
- Event schedules or calendars
- Directory or membership listings
- Performance metrics and analytics
Avoid tables for: Long-form content, image galleries, blog posts, or narrative information. Tables are for structured data comparison.
Optimize Column Selection
Every column should serve a purpose. Ask yourself:
- Would users want to sort by this?
- Does this help in decision-making?
- Is this information scan-able at a glance?
Limit columns to 5-8 on desktop, 3-4 on mobile. More than that becomes visual noise.
Make Search Intuitive
Place the search box prominently at the top. Use placeholder text that guides users: "Search by product name, brand, or category..." instead of just "Search."
Set Smart Defaults
Default sorting matters. For products, most users want "Featured" or "Best Selling" first. For transactions, newest first. For prices, lowest to highest. Think about your user's primary goal and default to that view.
See It In Action
Experience how interactive data tables can transform your user experience. Try our live demo with real data and see the difference for yourself.
Try Interactive DemoCommon Mistakes to Avoid
Over-Styling
Fancy animations and excessive colors distract from the data. Keep styling clean and functional. Users are here for information, not a light show.
Ignoring Loading States
If your table loads slowly, show a loading indicator. Silent delays frustrate users. Visual feedback reassures them the system is working.
Breaking on Mobile
Test ruthlessly on actual mobile devices, not just browser resizing. Touch targets need to be large enough. Horizontal scrolling should be minimal or eliminated.
Forgetting Accessibility
Use proper table markup (<thead>, <tbody>, <th>). Add ARIA labels. Ensure keyboard navigation works. Screen reader users deserve the same experience.
Measuring Success
How do you know if your interactive table is working? Track these metrics:
- Search Usage Rate: What percentage of users are searching? High usage indicates the feature is valuable
- Sort Interaction: Are users clicking column headers? This shows engagement with the data
- Time on Page: Increased time usually means users are finding value (not struggling)
- Bounce Rate: Lower bounce rates suggest users are getting what they need
- Conversion Rate: For e-commerce, are table pages converting better than static lists?
The Future of Data Tables
As websites become more app-like, interactive data tables will become the baseline expectation, not a nice-to-have. Users won't tolerate static, unsortable data dumps. They expect the same powerful filtering and search capabilities they get in their favorite apps.
Our Interactive Data Table module positions you ahead of this curve. It's not just about keeping up—it's about delivering genuinely better experiences that keep users engaged, satisfied, and converting.
Getting Started
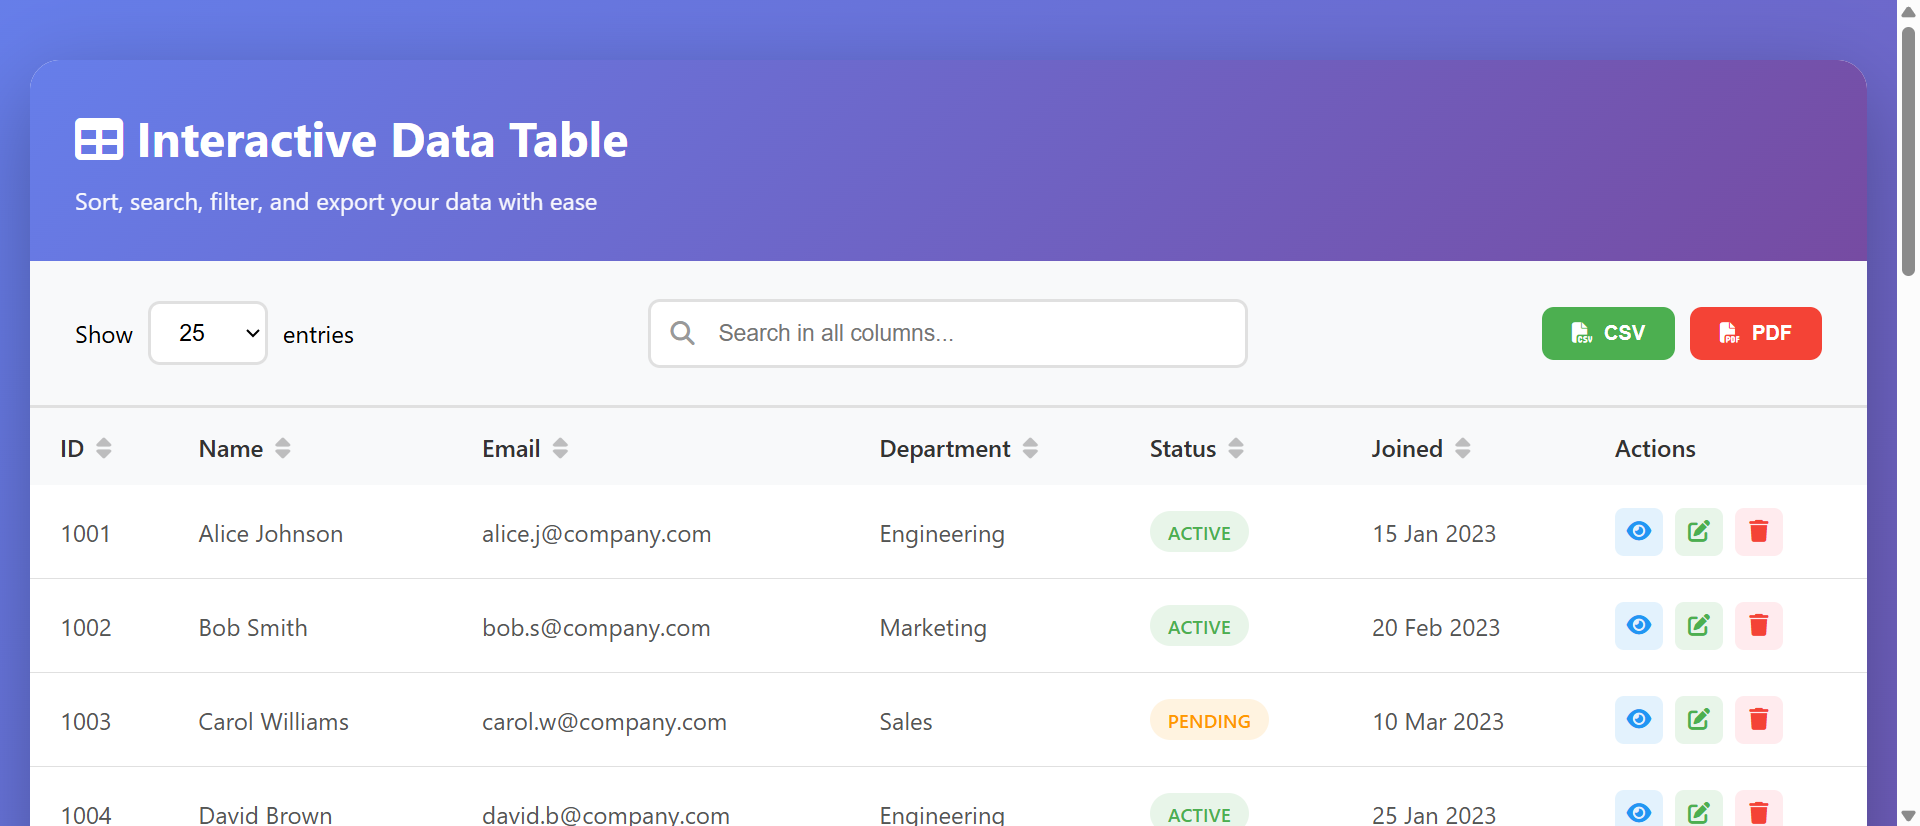
Ready to transform how you present data? The Interactive Data Table module integrates seamlessly into any website. It's production-ready with:
- Real-time search across all columns
- Click-to-sort on any column header
- Customizable pagination (10, 25, 50, 100 entries)
- Fully responsive mobile design
- Accessibility features built-in
- Clean, professional styling that matches any brand
Stop frustrating users with static data dumps. Give them the tools to find what they need, make informed decisions, and actually enjoy the process.
Transform Your Data Today
See how easy it is to implement professional, interactive data tables on your website.
View Live ModuleSee Interactive Data Table in Action
Experience how this module can enhance your website's functionality and user experience.
View Live DemoAbout this module: The Interactive Data Table is part of our comprehensive module library, designed to solve real user experience challenges with production-ready components. Each module is thoroughly tested, fully responsive, and ready to integrate into your projects.