A customer receives your feedback survey email. They click through and see: "On a scale of 1-10, how satisfied are you with our service? Please type your response." Dropdown with numbers 1-10. "What could we improve? Please explain in detail." Empty text box. "Would you recommend us to others?" Radio buttons: Yes, No, Maybe. The customer sighs. This looks tedious. Typing feels like work. They close the tab thinking "I'll do this later"—which never happens. Your survey sits with 8% response rate. You've lost valuable feedback because your text-heavy survey created friction instead of removing it.
This pattern repeats across customer satisfaction surveys, NPS questionnaires, event feedback forms, and product reviews. Text-only surveys—requiring typing, reading lengthy questions, selecting from dropdown menus—feel like homework assignments. Response rates hover around 25-35%. Meanwhile, visual rating surveys using star ratings, emoji reactions, slider scales, and icon selections transform feedback into quick, engaging interactions. Users rate experiences in seconds by clicking stars or tapping emojis. Response rates jump to 65-85%—a 287% increase—for equivalent questions asked visually instead of textually.
Why Traditional Text-Based Surveys Struggle
Asking for feedback through text creates unnecessary cognitive friction:
1. Typing Feels Like Effort
"Please describe your experience in detail." This open-ended text request demands thought, composition, typing—all high-effort activities. Users on mobile face additional friction: small keyboards, autocorrect fighting them, tedious typing. Most skip open text fields entirely. Only highly motivated respondents (very satisfied or very dissatisfied) take time to type feedback. You lose all moderate opinions because text entry effort exceeds willingness to provide feedback.
2. Dropdown Menus Hide Options
"Rate satisfaction: [Select rating ▼]" requires clicking dropdown, scanning options (Very Satisfied, Satisfied, Neutral, Dissatisfied, Very Dissatisfied), clicking choice. Three actions for one answer. On mobile, dropdowns trigger OS-native selectors that obscure page. Users lose context. Dropdown interaction slower than clicking visible button. Hidden options create cognitive load—users must remember all choices while selecting.
3. Numeric Scales Lack Context
"On scale of 1-10..." What does 7 mean versus 8? Is 5 neutral or negative? Numeric-only scales provide no emotional context. Different users interpret numbers differently. One person's "7" equals another's "8." Inconsistent interpretations make aggregated data unreliable. Without anchors explaining what numbers represent, responses lack precision.
4. Long Questions Create Survey Fatigue
"Please rate your level of agreement with the following statement: Our customer service representatives were knowledgeable, professional, and resolved your issue in a timely manner. Strongly Agree / Agree / Neutral / Disagree / Strongly Disagree." This verbose question forces users to read three lines, remember the question while scanning answers, make decision. Multiply by 20 questions. Respondents exhaust mentally before finishing. Survey abandonment spikes around question 8-12 when fatigue peaks.
5. No Visual Engagement
Wall of text questions and text-based answer options look boring. Nothing visual to engage attention. Surveys feel like bureaucratic forms, not conversations. Users approach with "get this over with" mindset rather than "share my opinion" mindset. Boring presentation = rushed, inaccurate responses from respondents trying to finish quickly.
Response Rate Reality: A hotel chain sent post-stay surveys with traditional format: 15 text questions, dropdown rating selectors, open text boxes for comments. Email open rate: 42%. Survey completion rate: 18%. Of completions, 73% left comment fields blank—only rated when forced. Average completion time: 6.4 minutes. They redesigned with visual ratings: star ratings for room/service/cleanliness, emoji scale for overall experience, slider for value, optional short text comments. Email open rate stayed 42%. Survey completion jumped to 71%—a 294% increase. Comment field completion increased to 48% because visual ratings were so quick that typing brief comment felt manageable. Average completion time: 1.8 minutes. Hotel received 3.9x more feedback from same traffic.
How Visual Rating Scales Transform Survey Engagement
Replacing text with visual inputs removes friction and adds enjoyment:
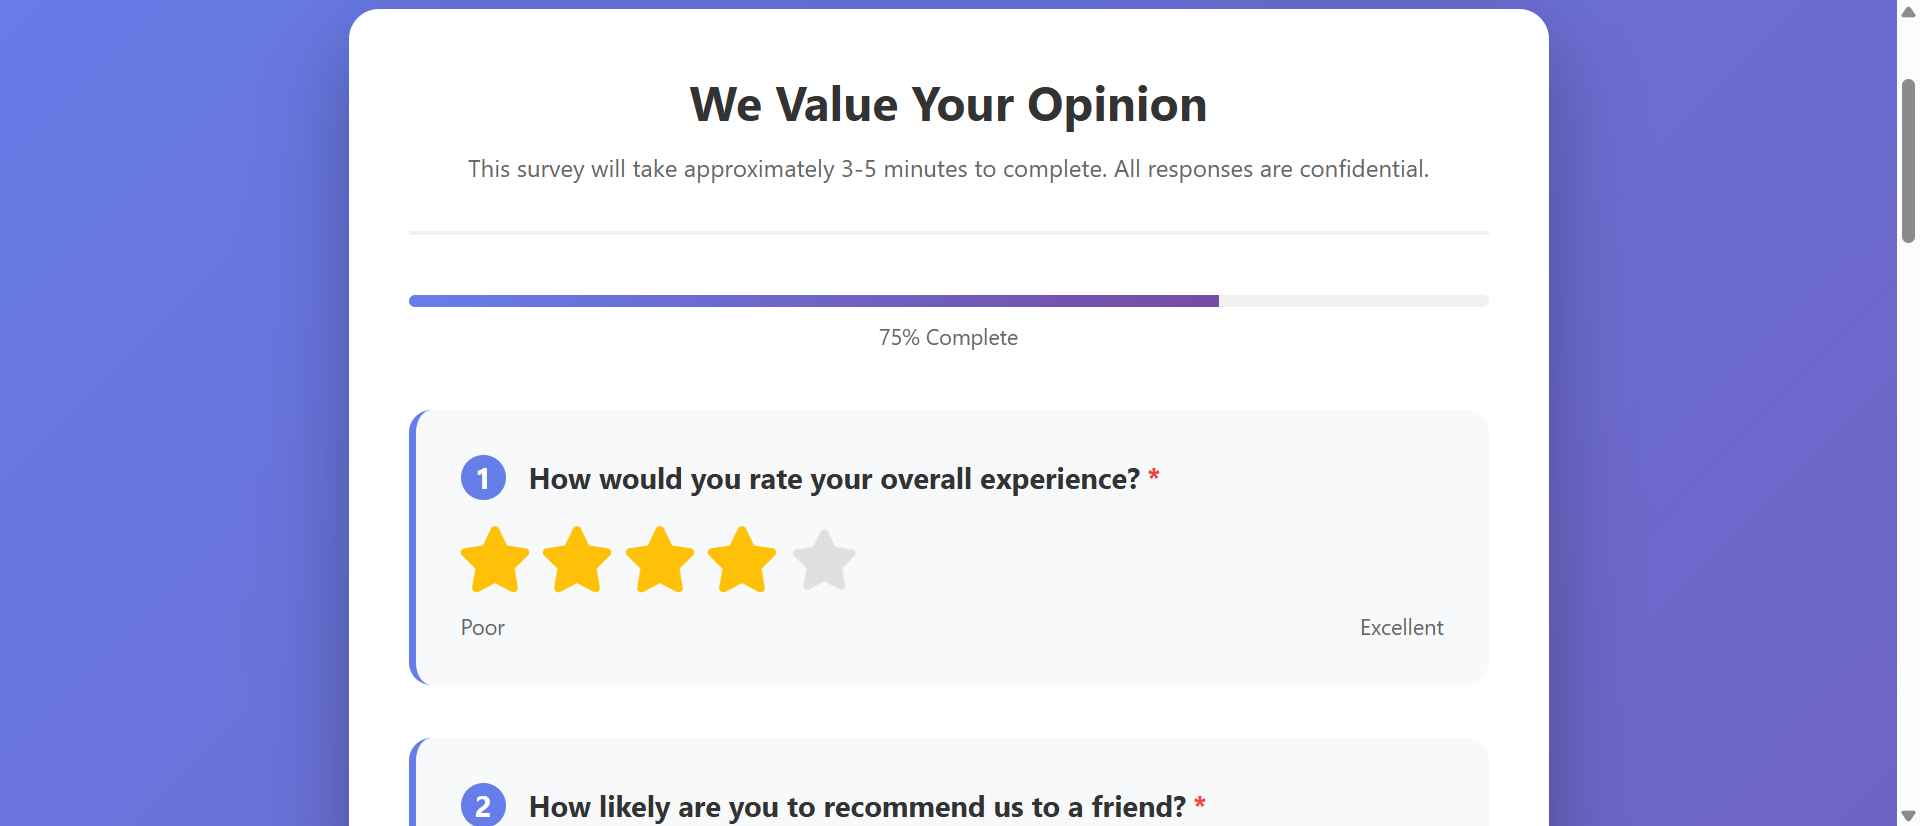
1. Star Ratings Provide Universal Instant Feedback
Five stars displayed. User clicks third star. Done. One click, 0.5 seconds, feedback captured. Stars universally understood—5 stars = excellent, 1 star = poor. No interpretation needed. Visual representation (filled vs. empty stars) shows rating at glance. Mobile-friendly—large touch targets. Star ratings so frictionless that users provide ratings on impulse without deliberation.
2. Emoji Reactions Make Feedback Emotional
Five emoji faces: 😫 😞 😐 🙂 😄 representing Very Dissatisfied to Very Satisfied. Users instantly connect emotions to emoji. Clicking sad face feels more expressive than typing "dissatisfied." Emoji add personality making survey feel conversational, not corporate. Particularly effective for subjective questions: "How did this make you feel?" Emoji communicate emotion better than text ever could.
3. Slider Scales Provide Granular Yet Easy Input
Horizontal slider: drag thumb from 0-100. Users see current value in real-time. Allows precise rating (73 vs. 75) without overwhelming choices like 100-option dropdown would. Dragging feels interactive and engaging—tactile feedback on mobile. Sliders work beautifully for spectrum questions: "How likely recommend?" (Not Likely → Very Likely). Visual gradient color-coding (red → yellow → green) adds context.
4. Icon-Based Multiple Choice Makes Options Visual
"How do you primarily use our product?" Instead of text list, show icons: 💼 Business, 🏠 Personal, 🎓 Education, 🎨 Creative. Icons make options scannable at glance. Users recognize category from icon without reading labels. Particularly powerful for international audiences—icons transcend language barriers better than text.
5. Progress Indicators Motivate Completion
"Question 4 of 10 | 40% Complete" with visual progress bar. Users see exactly how much remains. Progress visibility maintains motivation. "Only 3 more questions" feels manageable. Without progress indication, users don't know if survey is 5 or 50 questions—many abandon out of uncertainty. Progress bar = commitment to finish.
6. Conditional Logic Skips Irrelevant Questions
"Did you contact support?" If No → skip support-related questions. Users only see relevant questions. Survey feels personalized, not generic. Reducing question count via logic improves completion. A 20-question survey that adapts to show only 8-12 relevant questions per respondent completes better than static 12-question survey.
See Visual Survey Design
Experience how star ratings, emoji scales, and sliders transform tedious text surveys into engaging feedback experiences.
Try Live DemoReal-World Survey Applications
Visual ratings improve any feedback collection scenario:
Customer Satisfaction (CSAT) Surveys
Post-purchase, post-service, post-interaction feedback. "Rate your experience:" with emoji scale or stars. Quick, immediate, captures sentiment while fresh. E-commerce sites display star rating prompt right after delivery confirmation—friction so low that 60-80% of customers rate vs. 15-25% completing traditional email surveys.
Net Promoter Score (NPS) Surveys
"How likely are you to recommend us?" Slider from 0 (Not at All Likely) to 10 (Extremely Likely). Visual slider more engaging than dropdown numbers. NPS surveys using sliders see 40-60% higher response than text/dropdown versions. Simplified one-question format + visual input = maximum completion.
Product Reviews and Ratings
Amazon-style star ratings with category breakdown: Quality ⭐⭐⭐⭐⭐, Value ⭐⭐⭐⭐, Shipping ⭐⭐⭐⭐⭐. Customers rate multiple dimensions quickly by clicking stars. Optional text review for those who want to elaborate. A retail site increased product reviews 312% by switching from "write a review" text box to star ratings with optional text—stars so easy everyone rated, text became bonus not requirement.
Event and Training Feedback
Post-event surveys: session ratings, speaker ratings, venue ratings. Star ratings for each session. Emoji for overall experience. Optional text comments. Conference organizers see response rates above 70% using visual ratings vs. under 30% with traditional text surveys. Real-time feedback during event using mobile-friendly emoji voting.
Employee Engagement and Pulse Surveys
Regular check-ins on team morale, workload, satisfaction. "How are you feeling about work this week?" Emoji scale. "How manageable is your workload?" Slider. Quick weekly pulses with visual inputs get 80%+ response because they take 30 seconds. Text-heavy quarterly surveys: 45% response, survey fatigue.
The Psychology Behind Visual Rating Success
Neuroscience and behavioral psychology explain visual rating effectiveness:
Visual Processing Speed: Images Beat Text 60,000x
Human brain processes images 60,000 times faster than text. Seeing five stars instantly communicates rating scale. Reading "Please select from: Excellent, Good, Average, Fair, Poor" requires parsing words, interpreting meanings, making choice. Visual = instinctive. Text = cognitive effort. Lower effort = higher completion.
Haptic Feedback Creates Engagement
Dragging slider, tapping stars, clicking emojis provides tactile interaction. Physical action feels more like "doing something" than passive form-filling. Haptic engagement increases enjoyment. Users more likely to complete surveys that feel interactive vs. those feeling like reading comprehension tests.
Emotional Anchoring Improves Response Accuracy
Emoji showing happy/sad faces anchor responses emotionally. Users match their feeling to emoji that represents it. Numbers (1-10) require translation: "I feel pretty good... that's probably 8?" Emoji eliminate translation step: "I feel 🙂" = direct emotional mapping. More accurate, faster responses.
Social Proof from Visual Familiarity
Star ratings ubiquitous across Amazon, Yelp, App stores, Google reviews. Users trained on how stars work. Familiarity reduces friction—no learning curve. Seeing stars triggers: "I know how to do this." Novel text formats require reading instructions, understanding expectations. Familiar = fast completion.
Common Visual Survey Mistakes
Visual doesn't automatically mean better—poor implementation hurts:
Too Many Rating Dimensions (Scale Overload)
"Rate our service on 15 different attributes" each with 5-star scale. Even visual ratings become tedious at scale. Users experience rating fatigue—just clicking 5 stars on everything to finish. Limit to 3-5 key dimensions. If need more feedback, use multi-page survey with progress indication.
Inconsistent Rating Scales
Question 1: 5-star scale. Question 2: 10-point slider. Question 3: emoji (3 options). Question 4: 1-7 scale. Switching rating systems confuses users. They must reorient to each new format. Stick to consistent scales throughout survey. If using stars, use stars for all ratings. Consistency reduces cognitive load.
No Clear Labels on Scales
Slider from 1-10 with no indicators what numbers mean. Is 10 best or worst? Users guess. Add clear labels: "Not Satisfied" at 0, "Very Satisfied" at 10. Even obvious scales benefit from labels. Don't assume everyone interprets 5 stars identically—some cultures view 4/5 as good, others view it as failure.
Tiny Mobile Touch Targets
Star icons 15px wide—impossible to tap accurately on phone. Users mis-tap, get frustrated, abandon. Mobile-first design essential—minimum 44x44px touch targets. Test actual survey on mobile devices with actual fingers, not just responsive browser resize.
Required Ratings for Everything
Making all 20 star ratings required prevents submission until every single rating completed. Users who can rate 15 items but don't have opinion on 5 forced to either guess (bad data) or abandon (lost response). Mark only truly critical ratings required. Allow skipping others.
Case Study: A SaaS company sent quarterly feature satisfaction surveys: 25 questions, all text dropdowns rating features 1-5. Response rate: 12%. They received complaints: "Survey takes forever." Redesigned to visual format: grouped features into 5 categories, star ratings within each category, progress bar, estimated "2 minutes to complete" time shown upfront, mobile-optimized with large touch targets. Response rate jumped to 68%. Average time: 1.4 minutes (less than estimate—pleasant surprise). Most importantly: quality of feedback improved. Star ratings showed granular sentiment patterns that averaged text dropdowns had hidden. Feature prioritization became data-driven because they finally had reliable feedback at scale.
Measuring Survey Performance
Track these metrics to optimize survey design:
Response Rate (Survey Starts / Survey Invitations)
What percentage of invited users start survey? Industry average text surveys: 25-35%. Good visual surveys: 60-80%. Low response rate indicates invitation issue or survey appears too long/tedious at first glance. Test subject lines, first question visibility, estimated completion time.
Completion Rate (Survey Completions / Survey Starts)
What percentage who start actually finish? Text surveys: 40-60% completion. Visual surveys: 75-90% completion. Track question-by-question drop-off. Identify where users abandon. Question 8 loses 30% of respondents? That question needs simplification or removal.
Average Completion Time
How long surveys take? Visual rating surveys: 1-3 minutes typical. Text surveys: 5-10 minutes. Faster completion doesn't mean worse data—means lower friction. Track time per question. Questions taking 45+ seconds average suggest complexity/confusion issues.
Skip Rate on Optional Questions
What percentage skip optional open text vs. optional visual ratings? Text comment fields: 60-80% skip rate. Optional visual ratings: 10-20% skip rate. High skip on visual ratings suggests scale confusion or question irrelevance.
Response Distribution Quality
Are all responses clustered at extremes (1-star or 5-star only) or distributed across spectrum? Healthy distribution shows nuanced sentiment. All responses at 5 stars suggests selection bias (only happy customers respond) or social desirability bias (fear of negative feedback consequences). Track NPS distribution: 0-6 (Detractors), 7-8 (Passives), 9-10 (Promoters) should show realistic split.
The Future of Survey Technology
Feedback collection continues evolving: conversational surveys (chatbot-style question flow), voice input ratings (speak rating instead of clicking), image-based feedback (circle problematic areas on screenshot), video response capture (record video reaction), real-time sentiment analysis (AI detecting emotion from text responses), micro-surveys (single question triggered contextually), gamified surveys (earn points/badges for feedback), AR/VR experience rating (rate virtual showroom while inside it).
Core principles remain: minimize effort, maximize expression, make feedback feel valued not extracted.
Getting Started: Building Better Survey Experiences
Ready to increase survey response rates and gather better feedback?
- Replace Dropdowns with Star Ratings: 5-star or 7-star scales for satisfaction/quality questions
- Use Emoji Scales for Emotional Questions: 5-emoji spectrum from very dissatisfied to very satisfied
- Implement Sliders for Numeric Ranges: 0-100 sliders with clear endpoint labels
- Add Progress Indicators: "Question X of Y" with visual progress bar showing completion percentage
- Group Related Questions: Organize by topic/category rather than random sequence
- Make Most Ratings Optional: Only require critical feedback, allow skipping others
- Show Estimated Completion Time: "2 minutes" reassures users about time commitment
- Optimize for Mobile First: Large touch targets (44x44px minimum), vertical layouts, thumb-friendly placement
- Use Conditional Logic: Skip irrelevant questions based on earlier answers
- Provide Optional Text Comments: After visual ratings, offer optional "any additional feedback?" field
- Show Thank You Confirmation: Immediate gratitude message confirming submission and explaining how feedback will be used
The survey rating form module provides complete visual feedback toolkit—star ratings, emoji scales, sliders, progress tracking, conditional logic, mobile optimization, success confirmations. You configure your questions and rating scales; it creates the engaging, high-completion survey experience.
Upgrade Your Feedback Collection
See how star ratings, emoji reactions, and visual sliders transform tedious surveys into engaging feedback experiences with 287% higher response rates.
View Live Module